A data visualisation of Stefan Sagmeister’s survey on The Happy Film posters
My interest was piqued by a series of Instagram surveys by Stefan Sagmeister, that were drawing thousands of votes, and I've offered to help to count and visualize the using JavaScript.
For some surveys, it was interesting to visualize the geographic location of each vote, and to look for patterns in different regions of the world. One of these was on the different poster options for the Happy Film.
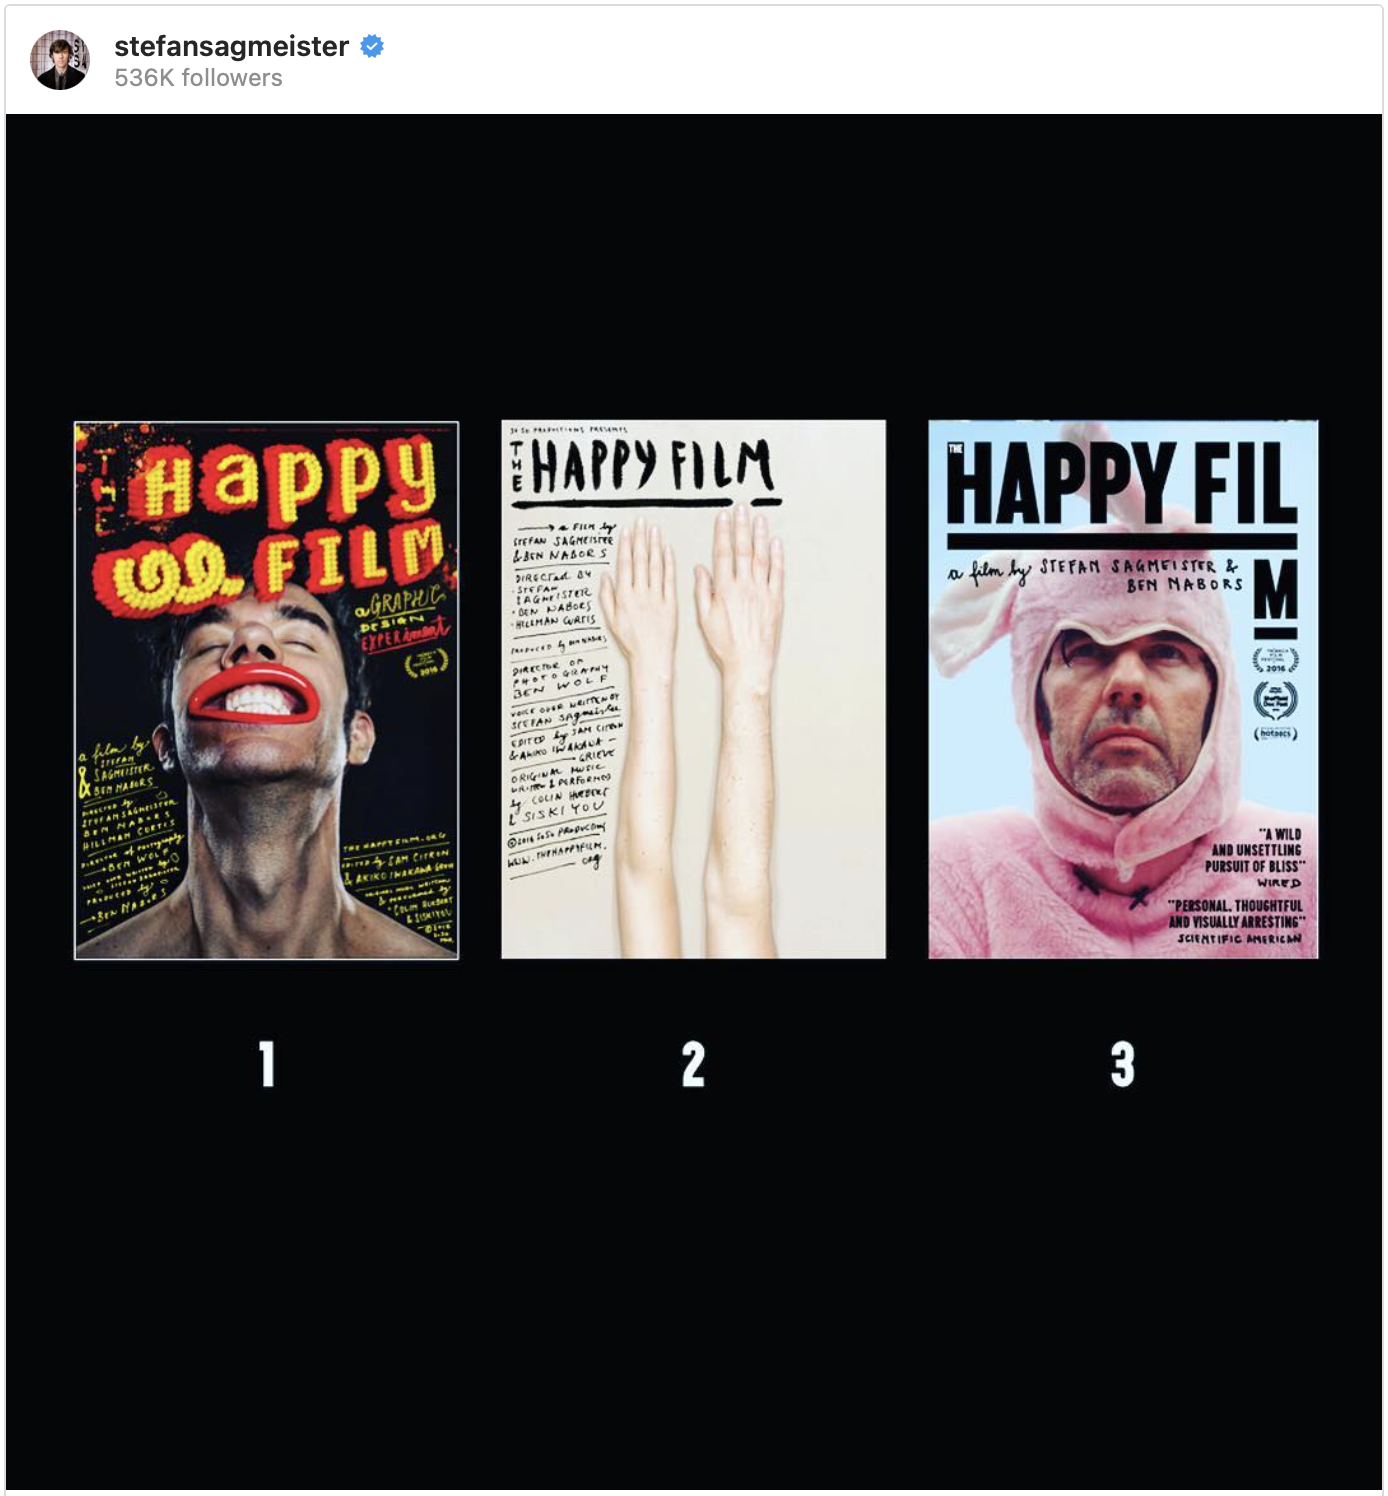
The poster versions were designed for the film’s different distribution areas, and I was curious to see the geographic distribution of people’s preferred designs.
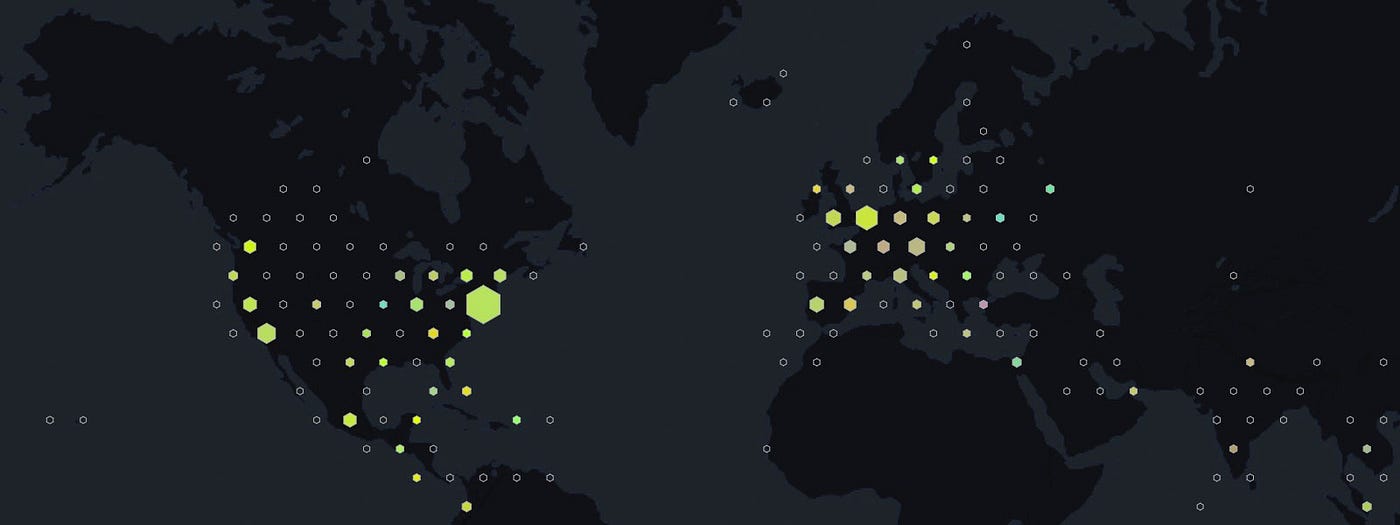
The location of voters was estimated from tagged locations of their most recent posts (within the last week) and represents their most likely location at the time of the vote. This means that the preference of one film poster over another is reflective of the environment in which it is experienced, as opposed to where the voter is from or where they are based.

This map is called a multivariate hexbin choropleth map (I think 🤔). It has voters grouped into geographical bins and colour coded based on the number of votes for each poster (4 variables). (It’s built with D3.js and Mapbox, I’ve added some code snippets, resources and credits below if you are interested.)
Humans are trichromats and can perceive three different colour hues, which makes it possible to read a tricolour colour legend. Typically, choropleth maps will use only one variable with a linear range between two colours (e.g. crime rates from blue to red). Mixing three colours can make the map more difficult to read… but it’s just like mixing primary colours in grade school! (Or mixing CMYK colours on a print project).

I ultimately chose to use a CMYK colour model because these colours are much easier to distinguish on a computer screen. This is probably a bias I have from working with mechanical files for digital prints, but the hue of the primary colours is misleading on the screen (e.g. the blue colour has a touch of red, which could be confused with red votes). The truest (and easiest) colour model to use on the web is RGB because it is used natively by the browser and computer screen, but mixing these colours is unnatural to me as I’ve never done it this way. A big thanks to Paul for suggesting to mix colours in the first place.

CMYK is a widely-used colour model in digital print, where four colours — Cyan, Magenta, Yellow and Key black — are mixed to obtain any desired colour combination. This worked great for my purposes, as there were three poster versions (votes 1 to 3), as well as “none of the above” (vote 0).
This means that a green colour hexagon has about half 1 (cyan) votes and half 3 (yellow) votes and so on. This also means that a grey-brown colour shows that there is little preference, because there is no dominating vote. There were few 0 votes (key black), so difference is subtle, but they do make some bins slightly darker. (For print nerds: there is no confusion between the rich black and key black because the votes add up to a “maximum ink coverage” of only 100%, see notes below.)

Try the live map and let me know what you think!
0110101001110011
D3.js
I used Asymmetrik’s Leaflet D3 along with a custom Mapbox map. Asymmetrik’s plugins are based on Steven Hall’s work, which has also been a really helpful reference.
To determine the colours I calculated the percent of each colour out of the total vote count for each bin.
function voteSums(d) {
categories = {}
var sum = d3.sum(d, function(data) {
vote = String(data.o.vote)
if (vote in categories) {
categories[vote]++
} else {
categories[vote] = 1
}
return +1
})
return {'votes': categories, 'sum': sum}
}// and in your d3.csv().fill() ...
return getColor(voteSums(d).votes, voteSums(d).sum)
The CMYK conversion is simple in that it doesn’t take into account any colour profiles, but it does the trick.
r = Math.round(255 * (1-c) * (1-k))
g = Math.round(255 * (1-m) * (1-k))
b = Math.round(255 * (1-y) * (1-k))
A note on the black colours: CMYK being a subtractive colour model, black can be achieved with both a rich mixture of CMY or with the key black (i.e. the rich black drama). However, because votes add up to 100%, the ‘maximum ink coverage’ would be 100% as well, which looks like a greyish brown in the browser, and therefore will not be confused with the key black.
To avoid having large areas of the map dominated by a colour with too few votes, I removed the colour for bins to few votes, dynamically adjusting it based on the map zoom.
var getMinBin = () => {
return 2+11/(map.getZoom()+1)
}
I could have used a bin radius that is proportional to the number of votes, but the larger cities had disproportionately more votes and I was more interested in the general preference tendencies by geographic region than the density distribution.
I had also gotten feedback that the map would be easier to understand if the colours were primary (RYB) instead of CMYK. It was surprisingly difficult to make it work, because converting to RYB required solving a trilinear interpolation… but thankfully Dave Eddy had already written a nice functionfor it. I ultimately preferred the original map, because I found that the of the primary blue as it reads on a computer screens looks like a mixed colour and does not work well for a colour legend.

Originally posted on Frontend Weekly